What we publish
Free to run with a story, with attribution.
The reports
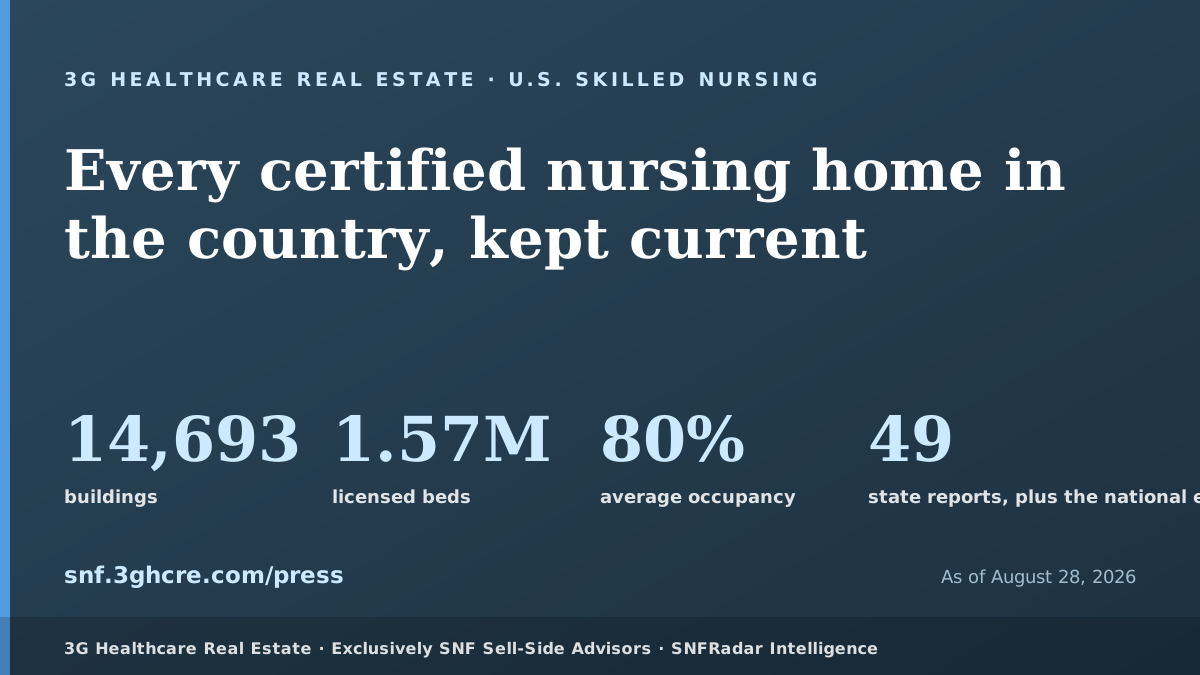
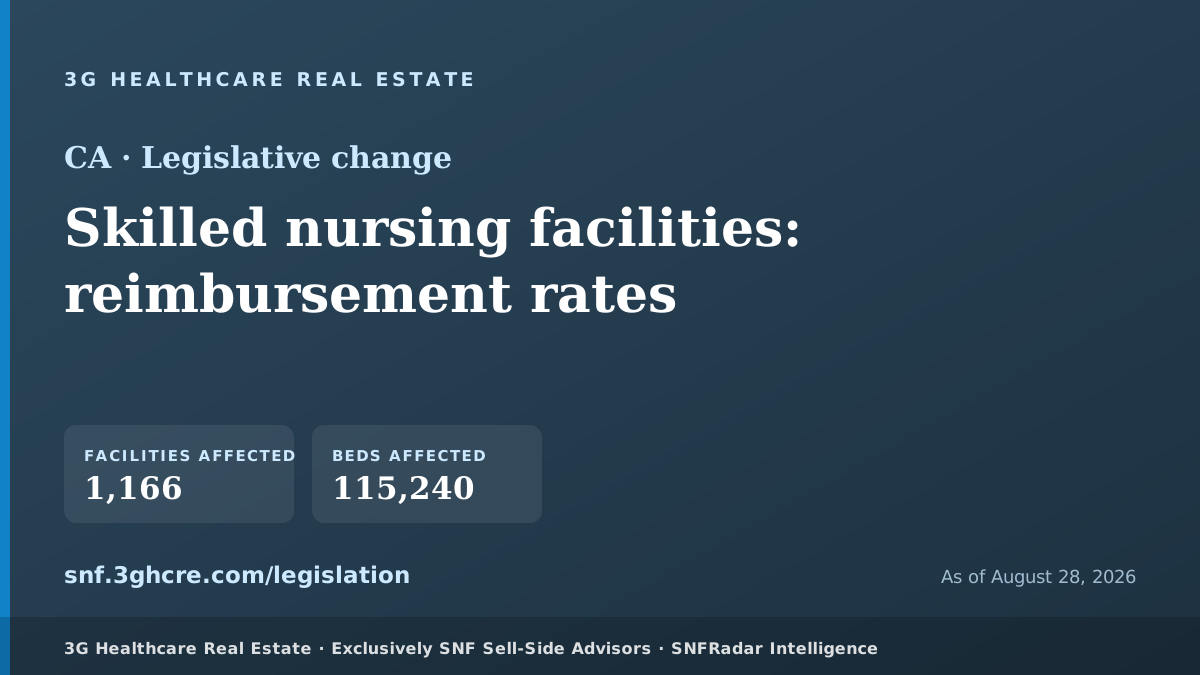
Free to read, free to quote with attribution. National, plus a few state editions, all fifty are one tap from the reader's own footer.
- 14,693 facilities
- 1.57M licensed beds nationwide
- 80% average occupancy
- 356 facilities
- 39,494 licensed beds
- 80% occupancy
- 507 facilities
- 48,888 licensed beds
- 75% occupancy
- 656 facilities
- 83,064 licensed beds
- 82% occupancy
- 922 facilities
- 81,107 licensed beds
- 83% occupancy
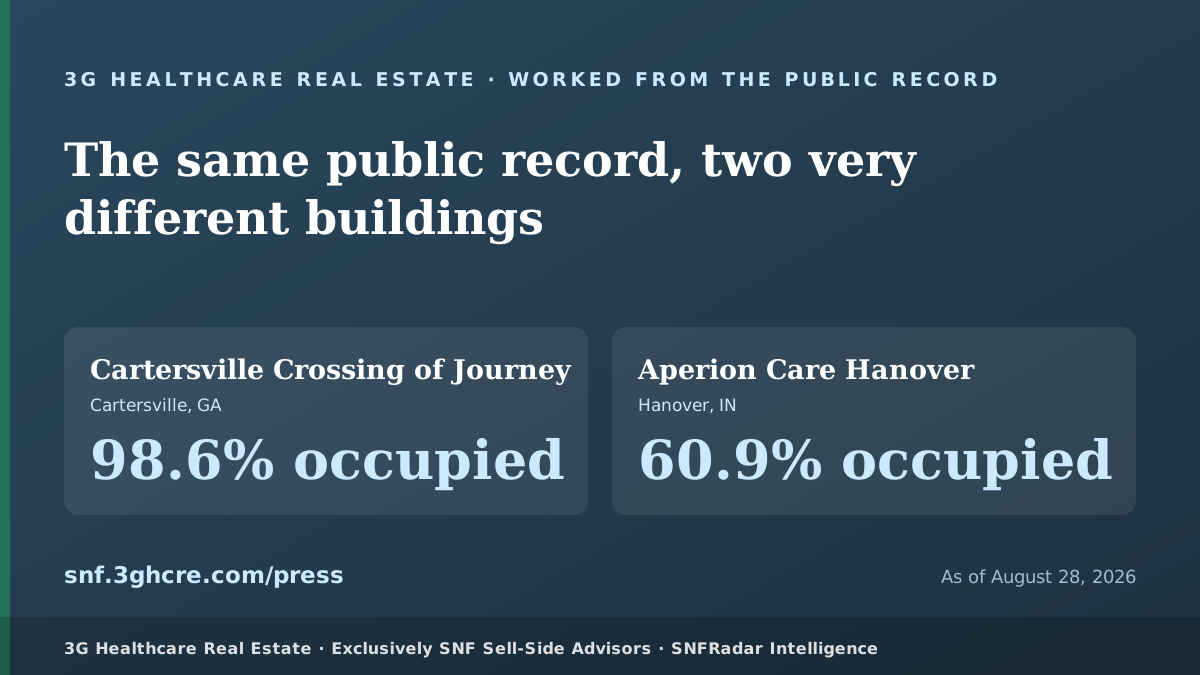
Two buildings, worked end to end
The same public sources every report is built from, read down to one building at a time.
The studies
Independent studies built from the federal record. Free to read, free to quote with attribution, and the state tables are free to reproduce whole.
The Rented Shift
What a building's reliance on agency nurses says about whether it changes hands
- Buildings running the most agency change hands the most. Under 2% of nursing hours worked by agency staff, 6.95% changed owner within two years. At 15% or more, 11.65% did. That is 1.7 times the rate, across 54,847 facility-years.
- It held in every year we could measure, and it widened. In 2018 the two ends were 6.02% and 6.25%, close to nothing. In 2022 they were 8.79% and 14.09%.
- Nobody has to draw a line, because the buildings draw it themselves. Cut the same panel into eight steps of agency reliance and the rate climbs at every one, from 6.62% among buildings that rented no agency hours at all to 14.56% among those renting more than 40% of their nursing hours.
- It is the reliance, not the role. Heavy on registered nurses, 10.87%; on practical nurses, 11.27%; on aides, 11.43%. Three different labour markets, one answer.
- It is not the star rating and it is not the empty beds. Hold the CMS rating still and the gap survives inside every band: at four and five stars, 8.98% of heavy-agency buildings changed hands against 5.98% of the lightest. Hold occupancy still and it survives there too: at 85% full and over, 8.67% against 5.63%.
- Today 1,580 buildings, 11.2% of everyone filing a full year, are above 15% agency. In Vermont it is two thirds of the state; in Pennsylvania and New Jersey, more than a quarter.
- New owners do cut it, and less than it looks. Heavy users that changed hands went from 28.72% to 16.81% agency in a year. Heavy users that did not change hands went from 26.62% to 19.52% over the same window. Most of the fall is what heavy users do anyway.
The Rented Shift came out of the first study. Once we could see how much of a building’s nursing time was being bought from an agency, the obvious question was what happens to those buildings next, and there is a public record that answers it: Medicare logs every change of ownership with the date it took effect. Nobody had put the two files side by side. We did, one observation per building per year, 54,847 of them, each followed for two years. Buildings renting 15% or more of their nursing hours changed hands at 11.65% against 6.95% for the ones renting almost none, and the gap held in every year we could measure. The part we did not expect is in finding seven, where a control group makes our own headline smaller: new owners do cut agency use, and most of the fall would have happened anyway.
3G Healthcare Real Estate / SNFRadar Intelligence, “The Rented Shift: what a building’s reliance on agency nurses says about whether it changes hands,” September 2026.
The staffing and agency figures here are refreshed each quarter, against the next Payroll-Based Journal release CMS publishes. Ask us and we will send the update when it lands.
Stan Klos III (Interviews and comment): [email protected] · Christian Patrick (Data requests and methodology): [email protected]
The Bedside Hour
What nine years of federal payroll and staffing records say about the cost of caring for one resident for one day
- Skilled nursing is running on 13,459 fewer workers than in 2019 while paying 36.7% more per week. The workforce never came back; the wage bill did.
- Care intensity has not moved in seven years. Nursing time per resident sits at 3.86 hours a day, within a rounding error of 2019, while occupancy has fully recovered to 81%.
- A resident-day of care costs the median state $185 in facility payroll, and every nursing hour delivered carries $46 of that payroll, from $31 in Wyoming to $65 in Oregon.
- Agency staffing more than tripled in the crisis and never went home. It was 3.0% of nursing hours in 2019, peaked at 10.5%, and is 5.3% today, still 77% above where it started, and it stopped falling last quarter.
- Thin staffing barely predicts hospital readmissions: 20.5% at the worst-staffed fifth of buildings against 20.3% at the best. The link the sector assumes is not in the data.
- Medicare pays as though it were, and it now prices staffing directly. 78.6% of all facilities are being penalized, and the gap between the best and worst staffed is worth about $147,000 a year.
The Bedside Hour started as a question sellers ask us before any other: what is staffing doing to my building’s value? We are a sell-side brokerage, so we hear it weekly, and we got tired of answering it with anecdotes. The federal government already collects the answer, every facility’s daily payroll journal, every quarter’s unemployment-insurance filings, every Medicare payment decision. It just publishes the pieces in places nobody joins together. We joined them: 1.3 million facility-months, nine years, every certified building in the country. The name is the unit everything in this industry is secretly priced in: one hour of care, delivered at a bedside. In the median state that hour carries $46 of the building’s payroll. Nobody had published that number. Now everyone can cite it.
3G Healthcare Real Estate / SNFRadar Intelligence, “The Bedside Hour: an independent study of skilled nursing staffing, cost and Medicare payment,” August 2026.
The staffing and agency figures here are refreshed each quarter, against the next Payroll-Based Journal release CMS publishes. Ask us and we will send the update when it lands.
Stan Klos III (Interviews and comment): [email protected] · Christian Patrick (Data requests and methodology): [email protected]
More from the same build
Press credential
A press account, in your name.
Every report and study on this site opens in full for a signed-in press account: invited directly, or requested below and approved by hand. It follows you to the newsroom machine at seven on a Tuesday, and it is how we know who to call if a figure needs correcting before you file.
- Every reportThe national edition and all fifty states, in full.
- Free to quoteFigures and cards run alongside your story, with attribution.
- Any deviceYour laptop, your phone, the newsroom machine.
- A number on requestAsk for a cut we do not publish and we build it.
We approve press accounts by hand, usually the same day. If we sent you a link directly, open that one instead: it is a single tap with nothing to fill in.
Spokespeople
Working on a story?
We will pull the numbers for whatever you are writing about, and we will tell you plainly when the data does not support it. No charge and no conditions.
Ask us for a numberOr reach us directly: [email protected] · 317.493.7767